


 Of all the quality management ‘gurus’, the late Philip Crosby is one of the most readable. In his book ‘Quality is Free’ (which comes thoroughly recommended, by the way), he advocates the use of a simple tool to discover where you are in the quality management spectrum: he calls it the Quality Management Maturity Grid.
What is Crosby’s Quality Management Maturity Grid?
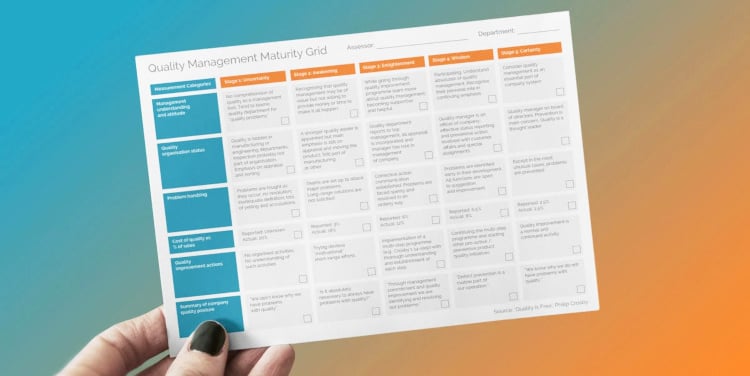
The grid is a simple 5 x 6 matrix that shows different stages of a company’s journey towards quality maturity within six different categories. These include ‘management understanding of quality’, ‘problem handling’, and the ‘cost of quality’.
The lowest stage of the maturity model is called ‘Uncertainty’ – where an organisation is inexperienced, quality management is a low priority and delivered reactively. But, as quality management matures it goes through the various stages of ‘Awakening’, ‘Enlightenment’ and ‘Wisdom’ - until it achieves the highest level, ‘Certainty’.

Each point on the grid – maturity versus category – has a brief description of how that combination appears in the company.
For example - if this sounds like your business:
“Problems are fought as they occur; no resolution; inadequate definition; lots of yelling and accusations.”
Then, according to Philip Crosby, you are at the ‘uncertainty’ stage of problem handling. And we’re sorry to hear it.
If, on the other hand: ‘You know why you don’t have quality problems’
Then Crosby suggests you have achieved ‘Certainty’ in your company’s ‘Quality Posture’. Which is, obviously, a great place to be..webp?width=300&height=218&name=Cognidox%20Quality%20Management%20graphic-opt%20(1).webp)

How to use the grid:
You use Crosby’s method by asking a number of people within the company to assess its performance in the following way.
First, download your matrix (see the link above).
Each participant then gets a copy and marks the grid to show which stage they think the company is at within each category. Drawing respondents from different levels and roles across an organisation gives you a complete picture of where you are. It’s also very important that they are completely honest in their assessment. In fact, you should make a point of explaining this to everyone who contributes.
What’s the cost of Quality (CoQ)
Cost of Quality can be tricky to explain and calculate - but here is an excellent blog on the subject by Jim Wells. Put simply, though, CoQ is the financial impact of quality on an organisation; the cost of both its implementation and its failure.
“Reported’ is what your people are telling you about the Cost of Quality. It’s the figure they might report on a normal day-to-day basis. And it’s usually underestimated as people tend to only take the superficial, obvious costs into account when thinking about this topic. ‘Actual’ is the real Cost of Quality when you include all of the factors and second-order effects in the calculation.
Philip Crosby’s assertion is – if you don’t know what CoQ is, i.e. you don’t have a thorough way of calculating or reporting on it, then 20% would be a pretty good guess. Of course, it’s only a guess and there will be companies worse or better than that, but in his view, 20% was a good working average.
That’s quite a serious amount compared with costs – and profit margins – for most businesses and is one of the reasons Crosby says “Quality is Free”. Because if you can spend 5% of sales on Quality Management and save 20%, then you can make a huge difference to a company’s bottom line. It will, effectively, cost you nothing (or a negative amount).
Scoring for Quality Management
The total score for this exercise is obtained by adding up the scores for each category; Stage 1 ‘Uncertainty’ gives a score of 1, Stage 2 ‘Awakening’ = 2, Stage 3 = 3, and so on. The minimum score is therefore 6 (all categories are at ‘Uncertainty), and the maximum is 30 (all are at Certainty).
We know of no company that is at 30 so if you really are there, please get in touch as we’d love to meet you!
It is really interesting not only to see the scores for each category (as well as the total), but also the mean across all the assessors. And it’s just as fascinating to see how individuals from different departments or roles in the company mark each category. Big variances in scores indicate that people think the company performs very differently in a particular area. But why is that? Is the high or low score more appropriate? What needs to be done about a low score emerging from just one part of a business? It can be a revealing exercise.
The thing I particularly like about the Quality Management Maturity Grid is that:
- It’s very quick and easy to use.
- It gives you insight – and it makes you think.
- It doesn’t just show you where you are but, also, what your company would have to be like to get a higher score.

The grid, therefore, can act as a diagnostic tool AND a route map for strategic quality. It can help you pin and plan the continuous improvement initiatives that will help you achieve your quality goals.
In other words, it can help you move steadily away from the chaotic left, and towards the ‘certain’ right of the grid.
Tom Gaskell is Cognidox’s Quality Specialist. He has worked with Cognidox since 2009 and was the original creator of what is now the Cognidox gBMS platform. No one has more experience of using the gBMS to successfully develop and deploy quality and business management systems.
Blog post updated on 18/07/2023


%20(1).webp?width=133&height=76&name=ISO%20IEC%2027001%20(1)%20(1).webp)